Home
Administration
Cantons
Culture
Economy
Education
Geography
History
Statistics
Various
FAQ
Index
Home |
Administration |
Cantons |
Culture |
Economy |
Education |
Geography |
History |
Statistics |
Various |
FAQ |
Index |
Hint: If you are not familiar with our metric unit system, see explanations about metric versus U.S. unit systems
Throughout Switzerland, there are hundreds of stations which collect meteorological data every day. The records go back about 200 years and are kept and maintained by Meteo Schweiz, formerly known as "Schweizerische Meteorologische Anstalt" (SMA). Unfortunately, Meteo Schweiz does not grant access this data, even tough they get founds from our taxes. If we want to know how much it rained yesterday or twenty years ago, we have to pay for this information. The information presented here are based on various public sources. The author has taken every effort to make sure the data is correct, however, there is no guarantee for correctness and completeness of the information provided here.
| To table of contents |
The weather in Switzerland varies greatly between different places. The highest precipitation receives Rochers de Nave, a mountain near Montreux (VD) with approximately 260 cm per year. Precipitation is generally higher in the western part of Switzerland where often clouds come in from the Atlantic coast. Also the parts south of the Alps get quite some rain, Lugano (TI) for example receives about 175 cm per year. If the winds blow in clouds from the south, they get blocked at the Alps and drop their water. Usually this causes dry and warm weather north of the Alps, often accompanied with heavy winds and an extremely good view where the mountains appear much closer than they are. This phenomena is known as Foehn ("Föhn"). Many people claim that they get headaches under these conditions.
On the other hand, the valleys
Engadin in the very east and Valais in the southwest of Switzerland receive relatively little precipitation. Scuol (GR) receives about 70 cm, Staldenried (VS) about 53 cm.
The average amount of sunshine per year is approximately 1700 hours. Some villages in the canton Valais claim that they get as much as 2300 hours of sunshine per year.

The figure above shows a map of Switzerland and indicates all locations for which climate information is available. Click on any name with orange background or any red bullet to get detailed information about that location. Find a detailed legend below:
| Location for which climate information is available, click on the name or bullet for details | |
| Location presented for better orientation, no climate information available | |
| Normalized climate diagram. Shows elevation, total yearly precipitation and yearly average temperature in normalized diagrams, which allow easy and quick comparison of climatic key values between different locations. | |
| Normalized elevation | |
| Normalized total yearly precipitation | |
| Normalized average yearly temperature |
| To table of contents |
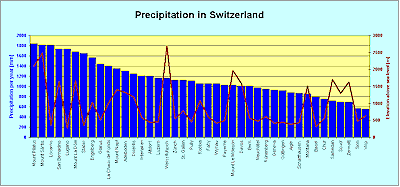
The diagram below shows the amount of yearly precipitation in relation to the elevation of the various locations. There is no correlation between elevation and precipitation at all.

| To table of contents |
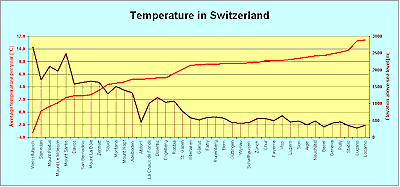
The diagram below shows the average yearly temperature in relation to the elevation of the various locations. There is a strong correlation between elevation and temperature. Very generally speaking, the temperature drops about one degree Celsius with every 200 meter (650 feet) elevation gain.
The three towns at the right end of the diagram are all located south of the Alps, which also has an influence on the average temperature.

| To table of contents |
| To table of contents |
Home | Administration | Cantons | Culture | Economy | Education | Geography | History | Statistics | Various | FAQ | Index | Search
| www.about.ch is brought to you by TRAMsoft GmbH The company for hi-tech watches, global positioning systems (GPS) and mobile computing (This document does not require any browser specific features and is compliant with the W3C standard "HTML 4.01 Transitional") index.html / 14-May-2013 / reto ambühler |
 |